Grafana is an
open-source observability and visualization platform used to monitor,
analyze, and visualize metrics, logs, and traces from different data
sources. It provides interactive dashboards and powerful alerting
capabilities, making it one of the most popular monitoring tools for
DevOps, SRE, and cloud environments.
I can integrate Grafana to different types of databases Like:
- Prometheus
- Loki
- Elasticsearch
- MySQL
- PostgreSQL
- InfluxDB
- CloudWatch
- Azure Monitor
- OpenSearch
Why Use Grafana?
- Monitor infrastructure and applications
- Visualize system metrics in real time
- Create custom dashboards
- Generate alerts and notifications
- Analyze logs and traces
- Troubleshoot performance issues
- Monitor cloud and Kubernetes environments
Architecture of Grafana
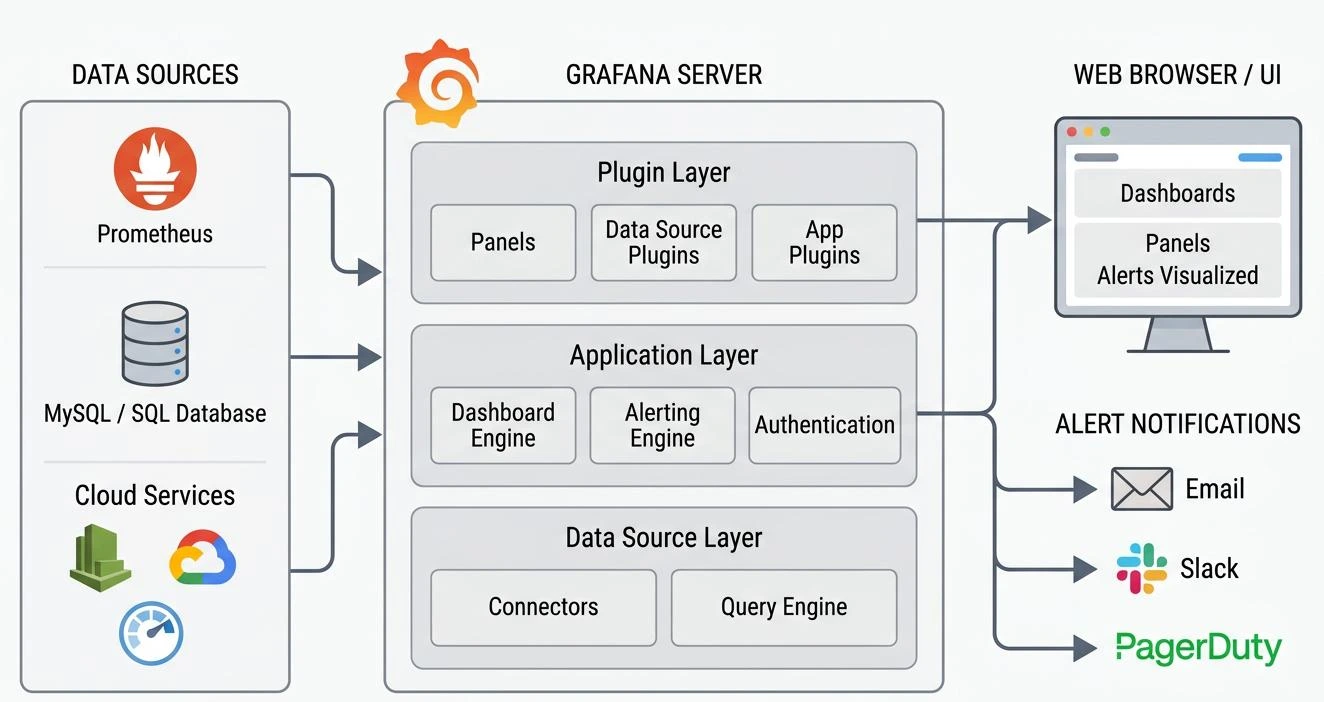
Components
Data Sources
Grafana collects metrics and logs from external sources.
- Prometheus
- Loki
- Elasticsearch
- MySQL
- CloudWatch
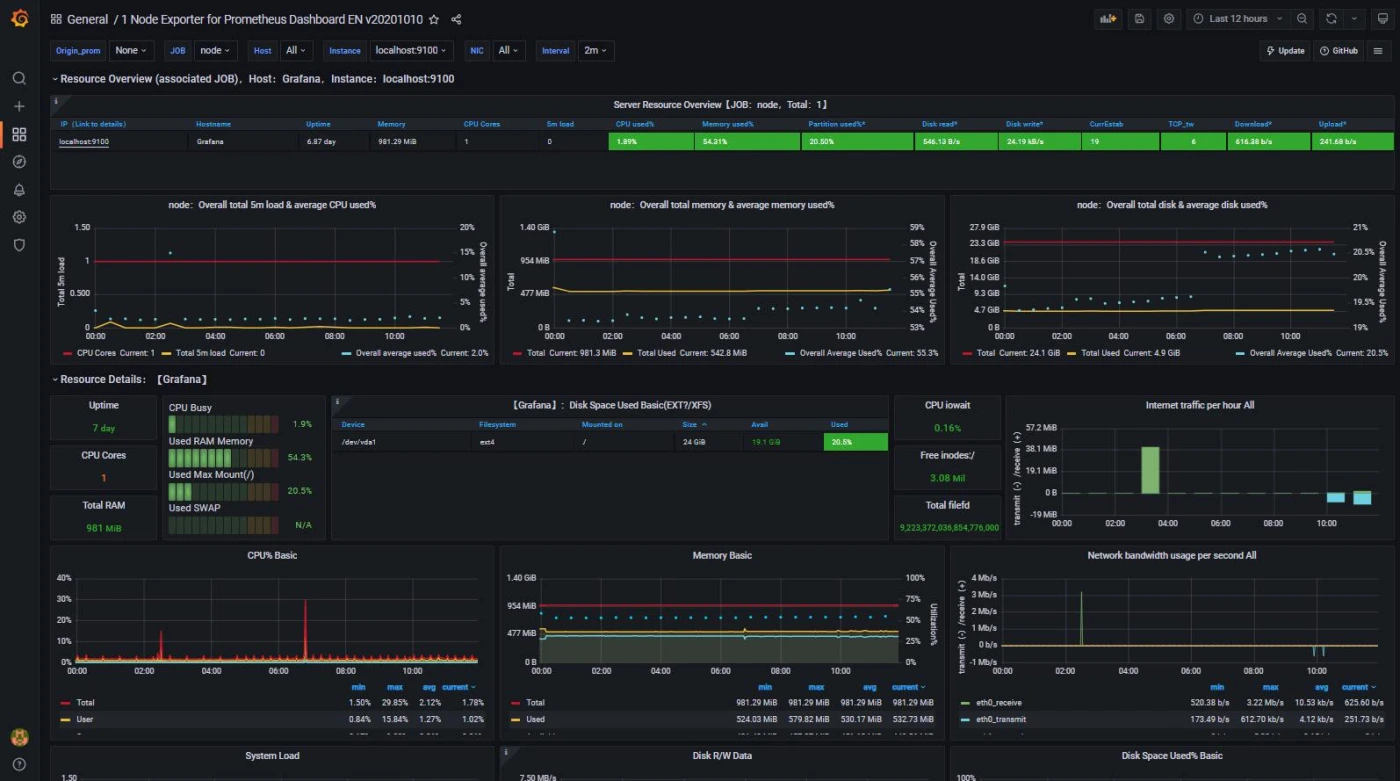
Dashboards
Dashboards consist of panels used for visualizing:
- CPU usage
- Memory utilization
- Disk I/O
- Network traffic
- Application metrics
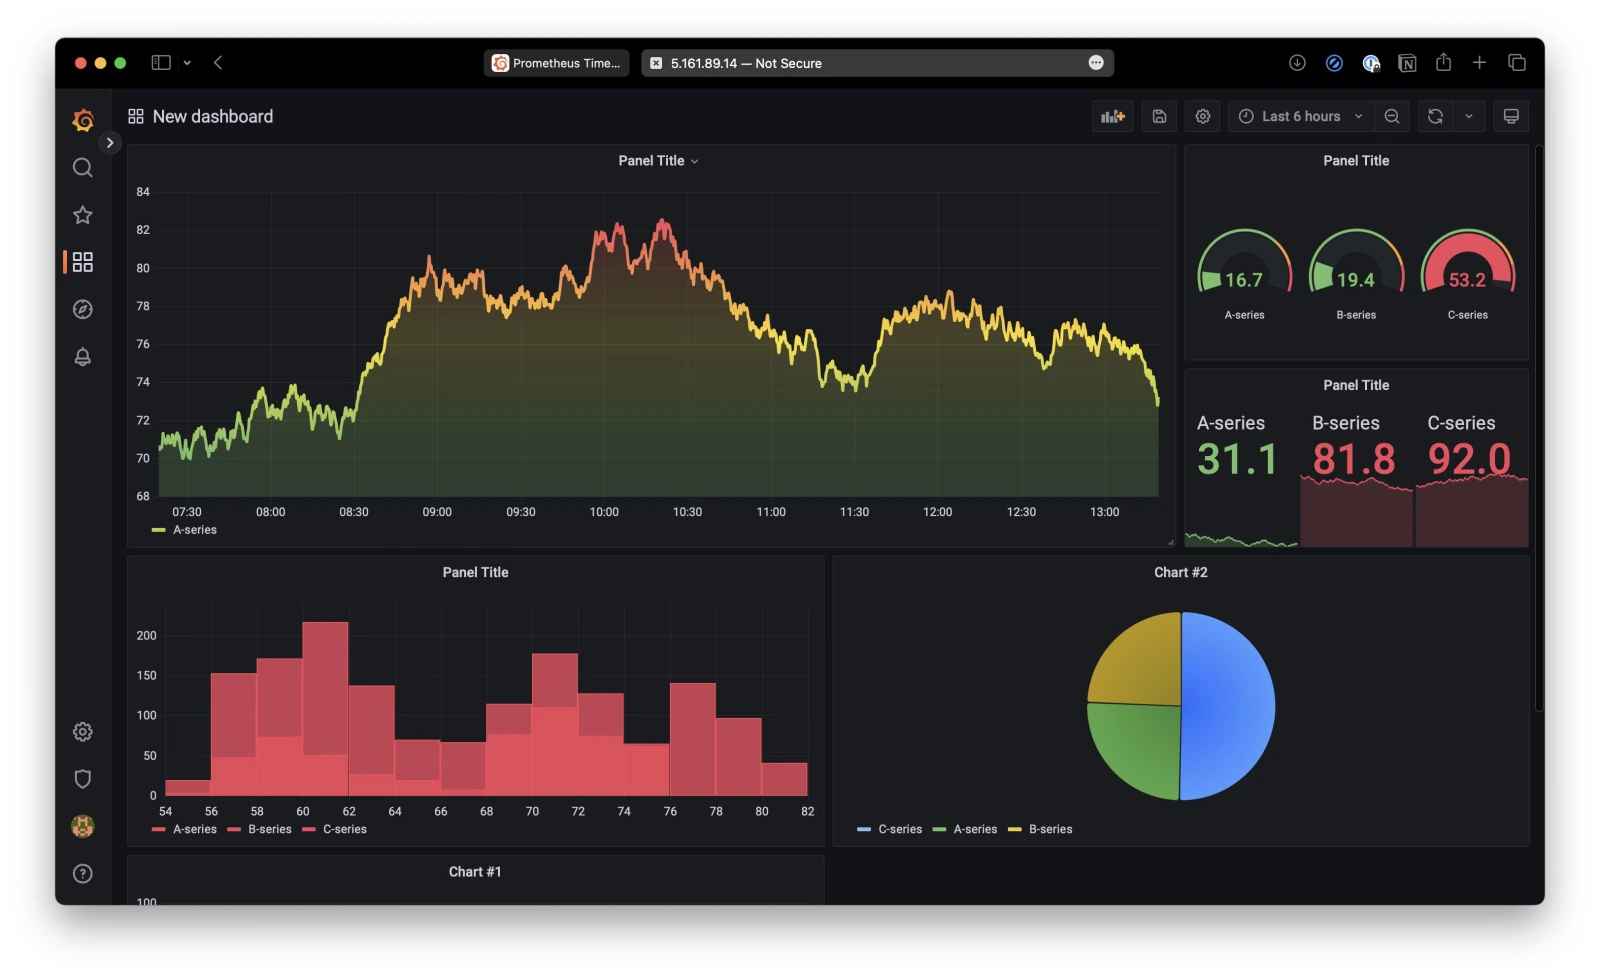
Panels
Common panel types include:
- Time Series
- Bar Chart
- Gauge
- Pie Chart
- Heatmap
- Table
Alerting Engine
Generates alerts when conditions exceed thresholds.
- CPU > 80%
- Memory > 90%
- Disk usage > 85%
Installing Grafana
Install on Ubuntu,Debian
sudo apt-get install -y apt-transport-https wget gnupg
sudo mkdir -p /etc/apt/keyrings
sudo wget -O /etc/apt/keyrings/grafana.asc https://apt.grafana.com/gpg-full.key
sudo chmod 644 /etc/apt/keyrings/grafana.asc
echo "deb [signed-by=/etc/apt/keyrings/grafana.asc] https://apt.grafana.com stable main" | sudo tee -a /etc/apt/sources.list.d/grafana.list
# Updates the list of available packages
sudo apt-get update
# Installs the latest OSS release:
sudo apt-get install grafana
Install on RHEL or Fedora
wget -q -O gpg.key https://rpm.grafana.com/gpg.keyCreate
sudo rpm --import gpg.key
#/etc/yum.repos.d/grafana.repowith the following content:
[grafana]
name=grafana
baseurl=https://rpm.grafana.com
repo_gpgcheck=1
enabled=1
gpgcheck=1
gpgkey=https://rpm.grafana.com/gpg.key
sslverify=1
sslcacert=/etc/pki/tls/certs/ca-bundle.crt
# To install Grafana OSS, run the following command:
sudo dnf install grafana
# To install Grafana Enterprise, run the following command:
sudo dnf install grafana-enterprise
Install on Windows
https://grafana.com/grafana/download?edition=oss&platform=windows
Download the Installer file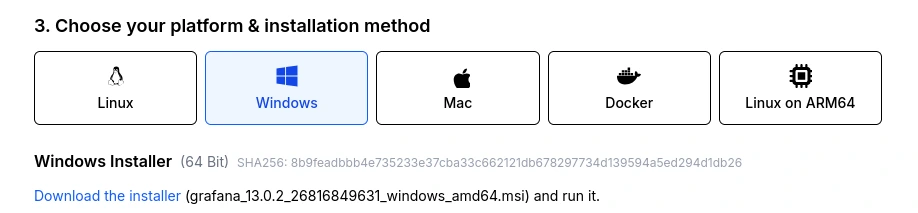
Double click on installer file and install it
Access Grafana
http://SERVER_IP:3000Default credentials:
Username : admin
Password : admin
You will be prompted to change the password after login.
Grafana vs Other Monitoring Tools
| Feature | Grafana | Kibana | Datadog | Zabbix |
|---|---|---|---|---|
| Open Source | Yes | Yes | No | Yes |
| Dashboard | Excellent | Good | Excellent | Good |
| Alerting | Yes | Yes | Yes | Yes |
| Logs | Via Loki | Native | Native | Limited |
| Metrics | Excellent | Moderate | Excellent | Good |
| Plugins | Thousands | Limited | Limited | Moderate |
| Cloud Monitoring | Excellent | Good | Excellent | Moderate |
| Cost | Free | Free | Paid | Free |
Role-Based Access Control (RBAC)
Provides:
- Admin
- Editor
- Viewer
Enterprise edition supports fine-grained permissions.
Grafana Ecosystem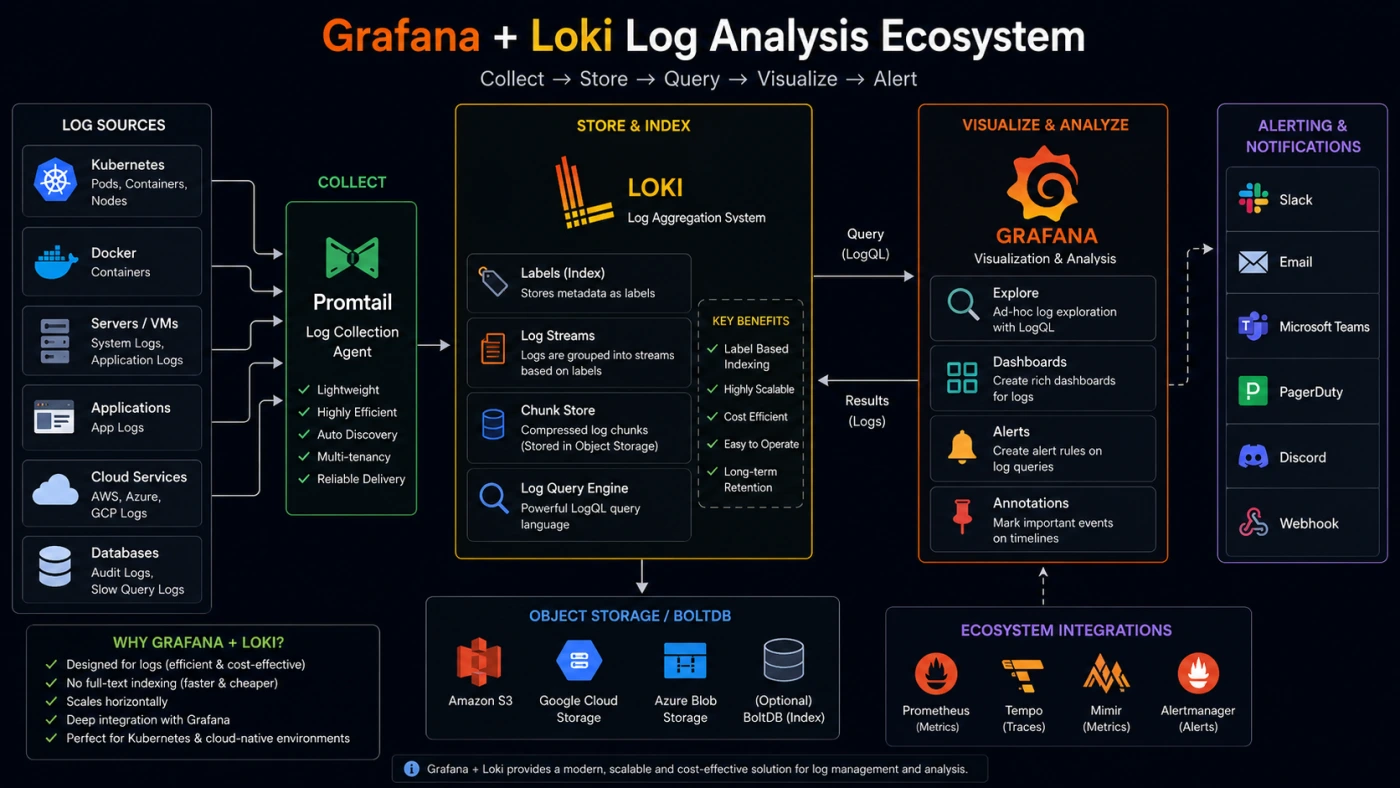
Limitations
- Does not collect metrics itself.
- Requires external data sources.
- Complex dashboards may consume resources.
- Enterprise features require licensing.
No comments yet. Be the first to comment!